
Community Health Status Report 2019
- Introduction
- Data Sources
- Demographic and Socioeconomic Features
- Family
- Income
- Language
- Education
- Change in Employment
- Conclusion
- References
- Appendix
Introduction
The Board of Health is required, under the Ontario Health Protection and Promotion Act, to regularly review the community’s health status. This enables the Health Unit and its partners to consider the features and needs of its community in the planning and design of health protection and promotion programs and services. The community health status assessment normally includes data on socio-demographics, mortality, reproductive outcomes, and health risk behaviours status.
The 2019 health status report focuses on the socio-demographic and economic conditions of the Eastern Ontario Health Unit catchment area, and how these conditions compare to other jurisdictions. The Eastern Ontario Health Unit catchment area includes the United Counties of Stormont, Dundas and Glengarry (SDG), which includes the City of Cornwall, the United Counties of Prescott and Russell, (UCPR) which includes the Town of Hawkesbury, and Akwesasne. The information is derived mainly from data in the 2016 Canadian Census (Statistics Canada).
Both individual and population health and illness are transitional states; they represent the outcome of numerous interactions between many biological, behavioural, environmental and socio-economic factors. Across the globe, population health is shaped by the Social Determinants of Health and their inter-dependence to one another. These determinants are the non-health factors that influence health and are derived from socio-economic, demographic, and environmental factors, geo-political conditions, and climate change.
The primary factors that shape the health of Canadians are not medical interventions or lifestyle choices, but rather the living conditions that they experience (Mikkonon and Raphael, 2010). Poverty causes ill health, which in turn perpetuates poverty. This cycle contributes to health inequalities and health inequities. People living in poverty experience a double deficit, a shorter and less healthy life. Despite universal agreement that health inequities are unacceptable and require urgent action, the gap in health status between the most affluent and the most disadvantaged has widened in recent years. Socio-economic conditions provide or deny opportunities for individuals to adopt healthy lifestyles. Population groups with low levels of income and education who are living in poor or precarious housing conditions, suffer more from ill-health than those at the top of the socio-economic scale.
Materials in this report may be reproduced with appropriate credit to the Eastern Ontario Health Unit. Readers seeking further information on community health are invited to contact the Eastern Ontario Health Unit.
Dr. Paul Roumeliotis, MD, CM, MPH, FRCP(C). CCPE
Medical Officer of Health and Chief Executive Officer
Data Sources
Data sources for the Health Status Report commissioned by the Eastern Ontario Health Unit (2019) include a large set of national and regional data sources such as:
- Census of Canada – Statistics Canada
- IntelliHEALTH Database – Ontario Ministry of Health and Long-Term Care (MOHLTC)
- integrated Public Health Information System (iPHIS) – Public Health Agency of Canada/Ontario MOHLTC
- Canadian Community Health Survey (CCHS) – Statistics Canada
- Ontario Cancer Registry (OCR) – Cancer Care Ontario (CCO)
- Rapid Risk Factors Surveillance System (RRFSS), Ontario, Canada – Institute for Social Research (ISR) at York University
- Local Data – Eastern Ontario Health Unit – Youth Risk Behaviour Survey (YRBS)
A note to the reader: In some data tables, you may notice that adding up the value of individual cells in any column or row does not produce the expected total. Statistics Canadxa rounds the numbers to the nearest 0 or 5 in the individual cells of data tables. We appreciate your understanding and apologize for any inconvenience this may cause.
Demographic and Socioeconomic Features
Catchment Area
The catchment area for the Eastern Ontario Health Unit (EOHU) is nestled in the easternmost part of the province of Ontario, along the Seaway Valley, east and southeast of the National Capital Region. It is bordered by the St-Lawrence River and the US borders to the south. It extends to the provincial borders with Quebec to the east and northeast (Figure 1). It covers the United Counties of Stormont, Dundas and Glengarry (UC-SDG), which includes the City of Cornwall, and the United Counties of Prescott and Russell (UC-PR), which includes the Town of Hawkesbury, and Akwesasne. The land area for this region is approximately 5,308 square kilometres.
Population
The 2016 census indicates that the target population for the EOHU is about 202,762 residents distributed among 15 municipalities, or Census Subdivisions (CSD), that vary in area size and population. In turn, the CSD in this region can be grouped into five counties: Stormont, Dundas, Glengarry, Prescott, and Russell. The CSD can also be grouped into two Census Divisions (CD): the UC-SDG, and the UC-PR. Three major urban centres exist in the EOHU region: the City of Cornwall and the Towns of Hawkesbury and Clarence-Rockland; most of the remaining municipalities are rural in nature. For all statistical tables or figures in this report, Stormont Dundas and Glengarry includes Cornwall data and Prescott Russell includes Hawkesbury data even when the specific region is given individually.
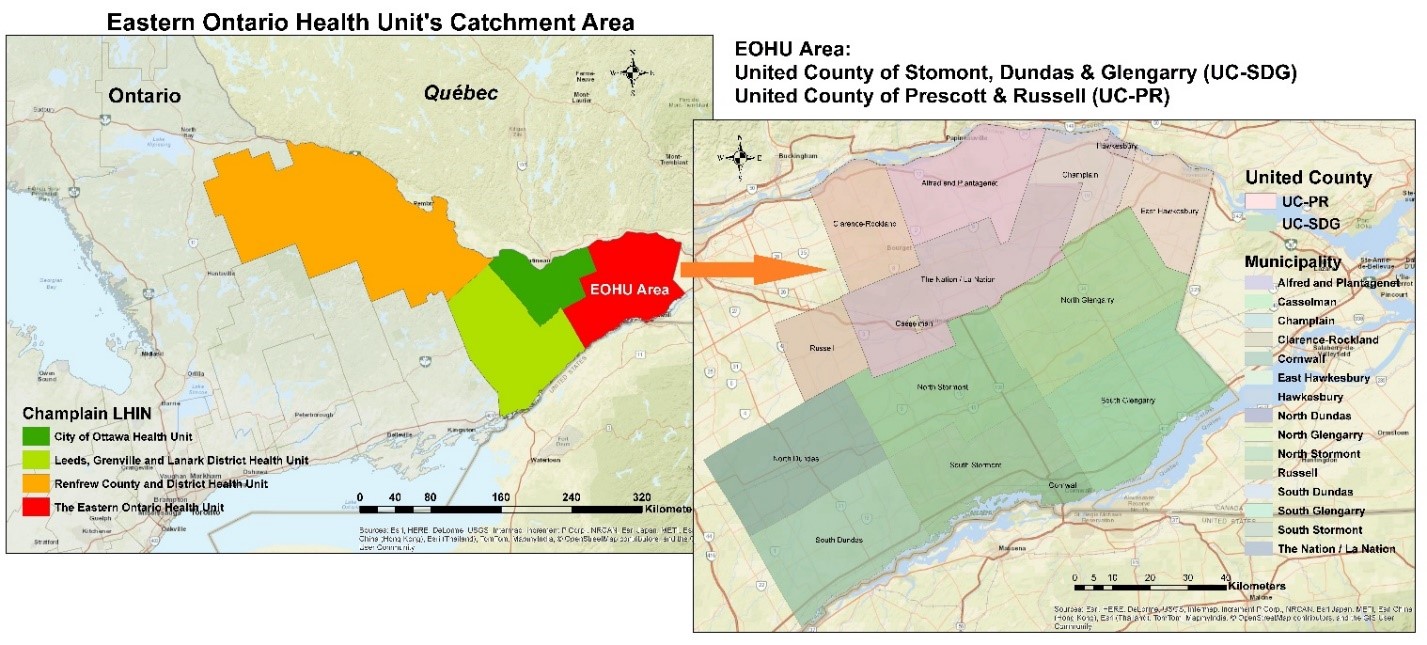
Figure 1: The Location of the Catchment Area for the Eastern Ontario Health Unit
Population Distribution
The overall population density for the EOHU catchment area is 38 per square kilometre. The City of Cornwall and the Town of Hawkesbury have the highest population densities in the region with 757 and 1067 per square kilometre respectively. On the other hand, North Stormont and Eastern Hawkesbury have the lowest population densities in the region with 13 and 14 per square kilometre respectively (Table 1).
| Population | Population 2016 | Land area / Km² | Population density / Km² |
|---|---|---|---|
| Cornwall | 46589 | 62 | 757 |
| South Stormont | 13110 | 448 | 29 |
| North Stormont | 6873 | 516 | 13 |
| South Dundas | 10833 | 521 | 21 |
| North Dundas | 11278 | 503 | 22 |
| South Glengarry | 13150 | 605 | 22 |
| North Glengarry | 10109 | 643 | 16 |
| Hawkesbury | 10263 | 10 | 1067 |
| East Hawkesbury | 3296 | 235 | 14 |
| Champlain | 8706 | 207 | 42 |
| Alfred & Plantagenet | 9680 | 392 | 25 |
| The Nation Municipality | 12808 | 658 | 19 |
| Clarence-Rockland | 24512 | 298 | 82 |
| Casselman | 3548 | 5 | 693 |
| Russell TP | 16520 | 199 | 83 |
| Akwesasne (Part 59) | 1487 | 12 | 125 |
| UC-SDG | 113429 | 3310 | 34 |
| UC-PR | 89333 | 2004 | 45 |
| EOHU | 202762 | 5314 | 38 |
| Ontario | 13448494 | 908699 | 15 |
Table 1: Population Distribution and Population Change, EOHU and Ontario
Population Structure by Age and Sex
The age structure for a population can be influenced by many socio-demographic conditions such as fertility, mortality, migration, employment and geo-political environment. The population pyramid in Figure 2 reveals the age-structure (five-year age groups) for the target population in 2016. Please note that in Figure 2, the bars represent the EOHU population, while the lines represent the Ontario population. Comparison of both population structures shows that, as compared to Ontario, the EOHU serves an older population. There is a smaller population in the 0-49 years age groups whereas the 50+years age groups are more populous than Ontario’s. A table with the data at the municipal level in the EOHU catchment area is shown in the appendix. Recently this trend has slightly reversed, as the proportion of children in the 0-9 years age groups is similar to Ontario’s.
At the local level, there are discrepancies in the population structure. For instance, the proportion of seniors (65 years and over) is higher in the Town of Hawkesbury than in the rest of the region, especially for females. Looking at the family age group, the Nation municipality has a higher proportion of adults aged 25-39 with children aged 0-4. Similarly, Russell Township has the highest proportion of adults aged 40-54 with children aged 5-19. On the other hand, the City of Cornwall has the lowest proportion of adults aged 40-54.
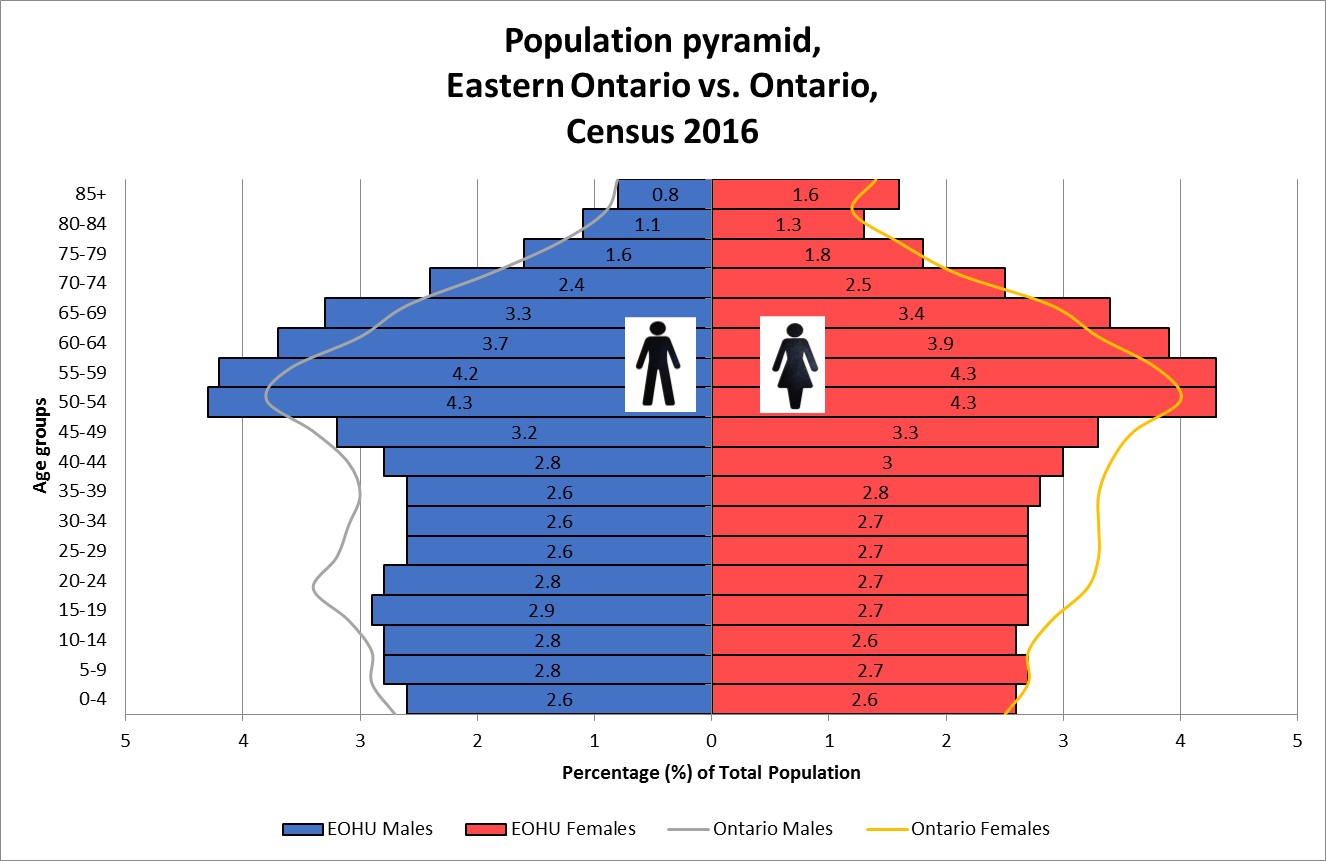
Figure 2: Population Pyramid for the Eastern Ontario Health Unit Catchment Area
Population Change
During each of the previous two inter-censal intervals (2006 to 2011 and 2011 to 2016), the Ontario population increased by more than 10%. The overall EOHU population follows the same trend, but at a lower rate (Figure 3).
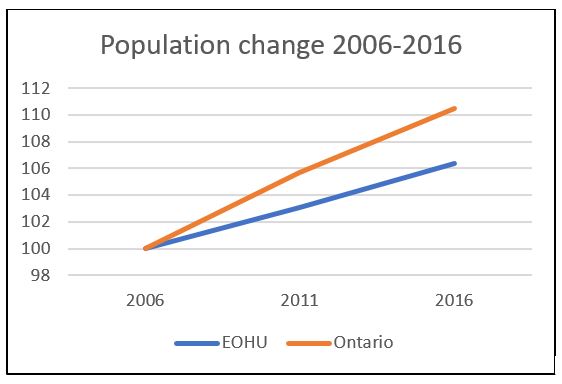
Figure 3: Change of Population from 2006-2016, EOHU and Ontario
Population change varied significantly across the EOHU region. The UC-PR lead in population growth between 2011 and 2016, matching Ontario’s growth rate of 4.6%, as compared to only 2.0% for the UC-SDG. Within the EOHU’s catchment area, The Nation Municipality led population growth, with a rate of 9.8%, whereas Hawkesbury had the lowest growth rate with a 2.7% population loss. The municipality of North Glengarry within the UC-SDG has continued to experience population loss since 1996. (Table 2 and Figure 4).
| Population and % of Population Change |
2011 | 2016 | Change % 2011-2016 |
|---|---|---|---|
| Cornwall | 46340 | 46589 | 0.5% |
| South Stormont | 12617 | 13110 | 3.9% |
| North Stormont | 6775 | 6873 | 1.4% |
| South Dundas | 10794 | 10833 | 0.4% |
| North Dundas | 11225 | 11278 | 0.5% |
| South Glengarry | 13162 | 13150 | -0.1% |
| North Glengarry | 10251 | 10109 | -1.4% |
| Hawkesbury | 10551 | 10263 | -2.7% |
| East Hawkesbury | 3335 | 3296 | -1.2% |
| Champlain | 8573 | 8706 | 1.6% |
| Alfred & Plantagenet | 9196 | 9680 | 5.3% |
| The Nation Municipality | 11668 | 12808 | 9.8% |
| Clarence-Rockland | 23185 | 24512 | 5.7% |
| Casselman | 3626 | 3548 | -2.2% |
| Russell TP | 15247 | 16520 | 8.3% |
| UC-SDG | 111164 | 113429 | 2.0% |
| UC-PR | 85381 | 89333 | 4.6% |
| EOHU | 196545 | 202762 | 3.2% |
| Ontario | 12851821 | 13448494 | 4.6% |
Table 2: Population and % of Population Change, EOHU and Ontario, 2011 to 2016
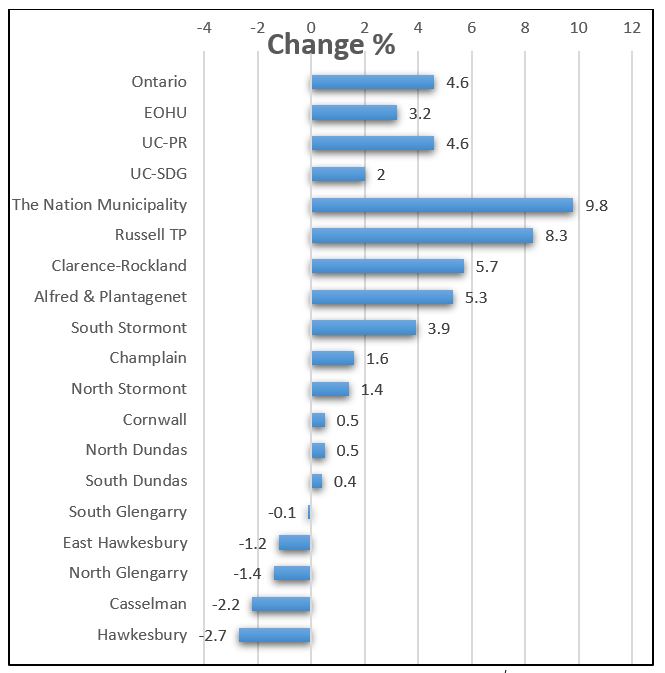
Figure 4: Population Change in 2011-2016
Population Changes in Children
The age group contributing the most to population growth in the EOHU’s catchment area are children aged 0-9. Figure 5 shows a net increase of 7.6% in the EOHU area for young children aged 0-9 years old. The increase is greater in the UC-PR (8.9%) than in the UC-SDG (6.5%). Likewise, Ontario experienced a net population growth amongst this age group during the period of 2011-2016, although with a smaller increase.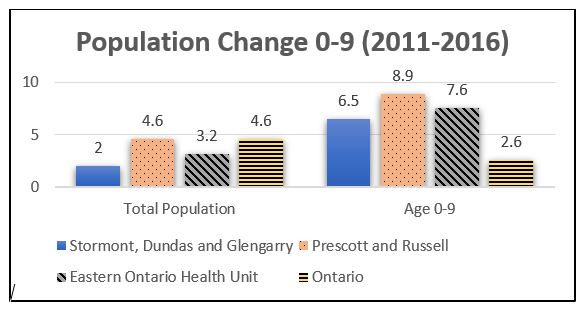
Figure 5: Population Change by Age Group (0-9), EOHU and Ontario
However, when we break it down to the very young (0-4 years old vs 5-9 years old), we see that the greatest increase is in the 5-9 years old age group (see Figure 6). Our rates compare favourably to those of Ontario, which has experienced a decline in the 0-4 years old age group and a smaller growth in the 5-9 years old age group.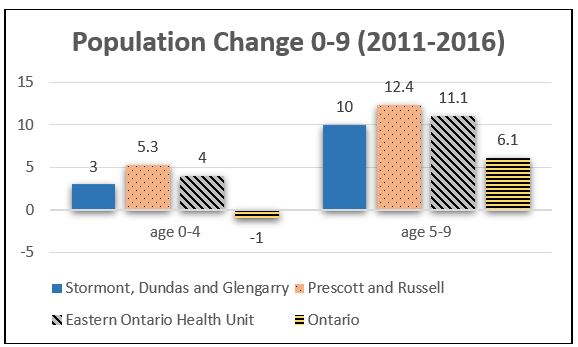
Figure 6: Population Change by Age Group (0-4 and 5-9), EOHU and Ontario
Aging Population
The Town of Hawkesbury, and the Townships of North and South Glengarry have the highest concentrations of seniors as compared with the EOHU catchment area and the province. The Township of Russell, The Nation Municipality, and Akwesasne, however, have maintained the lowest proportion of seniors (see Figure 7).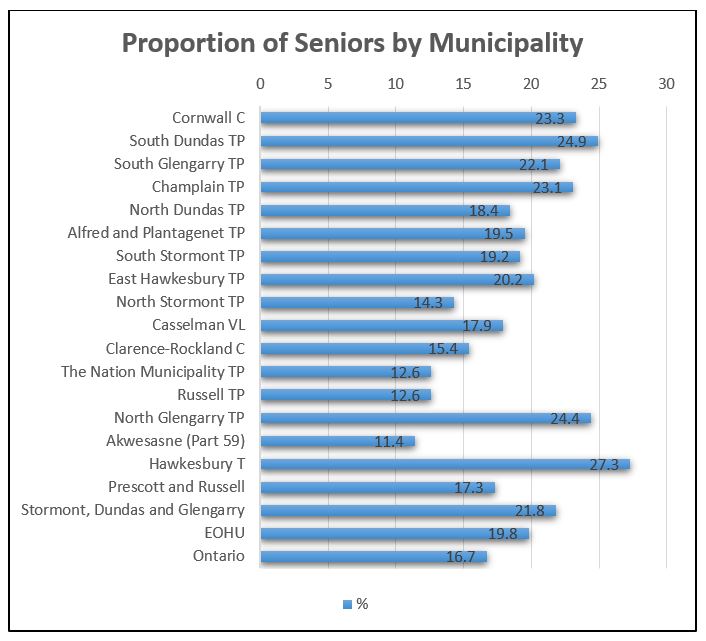
Figure 7: Proportion of People Aged 65 and Over, EOHU and Ontario, 2016
The proportion of seniors among the general population in 2016 has increased in both Ontario and the EOHU catchment area as compared to 2011 by 1% and 3% respectively. In 2016, within the EOHU region, the highest proportion is in the Town of Hawkesbury (27.3%) and the lowest is in Russell County (12.6%). The Town of Hawkesbury also had the largest increase (3.9%) from 2011 to 2016 (Figure 8).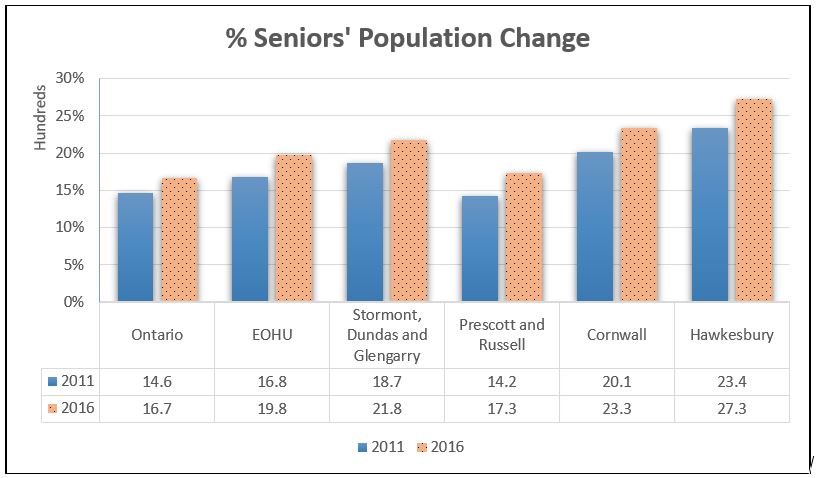
Figure 8: Seniors Aged 65 and Over, EOHU and Ontario, 2011-2016
Family
Census Families
In 2016, there were 60,605 census families in the catchment area of the EOHU. This represents a 3.7% increase over the number of families in 2011, which is slightly lower than the increase seen for Ontario (4.5%). Across the five counties in the EOHU region, family distribution proportionately mirrors the general population distribution. Within the EOHU’s jurisdiction, the highest proportion of census families resides in the City of Cornwall (21.7%), while Clarence-Rockland follows at 12.3%.
Table 3 indicates the proportion of different types of families. The number of lone-parent families throughout the region remained somewhat stable, with minimal increases.
| 2011 |
Total Number of Census Families in Private Households |
Total Couple Families | Married Couples | Common-Law Couples | Total - Lone-Parent Census Families | Female Parent | Male Parent |
|---|---|---|---|---|---|---|---|
| Ontario | 3612205 | 83.3% | 86.9% | 13.1% | 16.7% | 13.5% | 3.3% |
| EOHU | 58375 | 85.6% | 80.0% | 20.0% | 14.3% | 11.0% | 3.4% |
| UC-SDG | 32840 | 84.8% | 82.4% | 17.6% | 15.2% | 11.9% | 3.3% |
| UC-PR | 25535 | 86.8% | 77.1% | 22.9% | 13.2% | 9.7% | 3.5% |
| Cornwall | 13145 | 79.1% | 78.6% | 21.4% | 20.9% | 17.0% | 4.0% |
| Hawkesbury | 3035 | 76.8% | 70.6% | 29.4% | 23.1% | 18.6% | 4.4% |
| 2016 | |||||||
| Ontario | 3782545 | 82.9% | 71.0% | 12.0% | 17.1% | 13.7% | 3.3% |
| EOHU | 60605 | 85.2% | 66.5% | 18.7% | 14.8% | 11.2% | 3.6% |
| UC-SDG | 33640 | 84.1% | 67.4% | 16.7% | 15.9% | 12.3% | 3.6% |
| UC-PR | 26965 | 86.6% | 65.4% | 21.2% | 13.4% | 9.8% | 3.6% |
| Cornwall | 13155 | 78.4% | 60.0% | 18.5% | 21.6% | 17.4% | 4.2% |
| Hawkesbury | 2870 | 76.3% | 52.8% | 23.5% | 23.7% | 19.0% | 4.9% |
Table 3: Proportion of Different Types of Census Families in Private Households, 2011-2016
Lone-Parent Families
There are two ways to measure lone-parent families. The first one is by comparing the number of lone-parent families to the total number of Census families in private households (which includes families with and without children), whereas the second one is the proportion of lone-parent families among census families with children. The latter will be the one used in Table 4 and Figure 9.
In 2016, 27.9% of all “census families with children” in the EOHU catchment area were single-parent families, which is very similar to the rate of 27.4% for the province. These rates have remained stable since 2011. However, there are geographical variations across the EOHU area: in Akwesasne, 50% of all families are headed by a lone parent, with Hawkesbury a close second at 48%.
| # Families with Children (Couple with Children + Total LPF) | Lone-Parent Families # | Female # | Male # | Lone-Parent Families % | Female % | Male % | |
|---|---|---|---|---|---|---|---|
| South Stormont | 2095 | 450 | 325 | 125 | 21.5% | 15.5% | 6.0% |
| North Stormont | 1130 | 205 | 140 | 65 | 18.1% | 12.4% | 5.8% |
| South Dundas | 1615 | 455 | 340 | 120 | 28.2% | 21.1% | 7.4% |
| North Dundas | 1800 | 435 | 345 | 90 | 24.2% | 19.2% | 5.0% |
| South Glengarry | 1905 | 390 | 275 | 110 | 20.5% | 14.4% | 5.8% |
| North Glengarry | 1470 | 415 | 305 | 105 | 28.2% | 20.7% | 7.1% |
| East Hawkesbury | 515 | 110 | 75 | 35 | 21.4% | 14.6% | 6.8% |
| Champlain | 1265 | 300 | 195 | 100 | 23.7% | 15.4% | 7.9% |
| Alfred & Plantagenet | 1480 | 385 | 275 | 110 | 26.0% | 18.6% | 7.4% |
| Nation | 2220 | 430 | 305 | 120 | 19.4% | 13.7% | 5.4% |
| Clarence-Rockland | 4205 | 990 | 725 | 265 | 23.5% | 17.2% | 6.3% |
| Casselman | 580 | 170 | 130 | 45 | 29.3% | 22.4% | 7.8% |
| Russell | 3000 | 555 | 390 | 160 | 18.5% | 13.0% | 5.3% |
| Akwesasne (Part 59) | 310 | 155 | 120 | 30 | 50.0% | 38.7% | 9.7% |
| Cornwall | 7110 | 2835 | 2285 | 550 | 39.9% | 32.1% | 7.7% |
| Hawkesbury | 1425 | 680 | 545 | 140 | 47.7% | 38.2% | 9.8% |
| UC-SDG | 17425 | 5335 | 4140 | 1195 | 30.6% | 23.8% | 6.9% |
| UC-PR | 14695 | 3615 | 2630 | 980 | 24.6% | 17.9% | 6.7% |
| EOHU | 32120 | 8950 | 6770 | 2175 | 27.9% | 21.1% | 6.8% |
| Ontario | 2353965 | 644970 | 518480 | 126495 | 27.4% | 22.0% | 5.4% |
| Canada | 5816120 | 1612505 | 1262340 | 350465 | 27.7% | 21.7% | 6.0% |
Table 4: Proportion of Single Parent Families among Census Families with Children, EOHU, Ontario and Canada, 2016
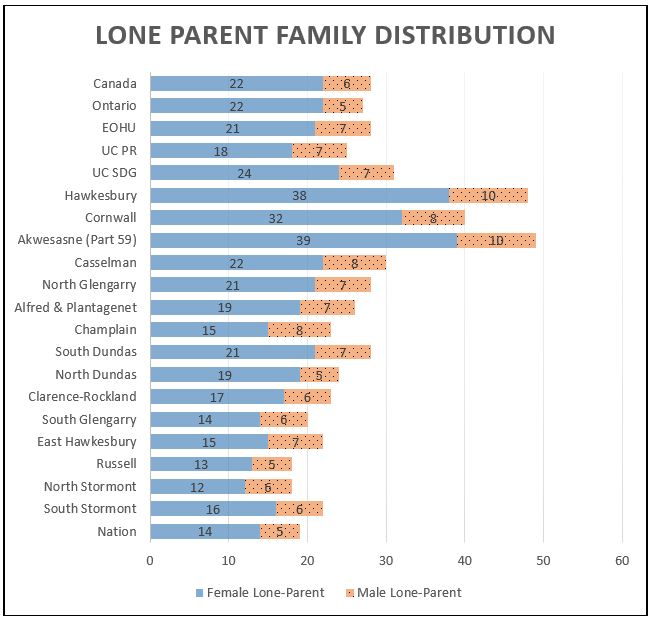
Figure 9: Proportion of Single Parent Families Among Census Families with Children, 2016
Income
Income Source
The population in the UC-PR enjoys a slightly higher rate of employment income as part of its total income (72% of total income is from employment), as compared to the UC-SDG population (65%). As for government transfer payments, respectively 12% of residents in UC-PR and 18% of residents in UC-SDG receive a government transfer. These rates are quite a bit higher than those in the rest of Ontario and Canada. Russell Township and The Nation Municipality have the highest proportion of employment income in the region (78%), while the Town of Hawkesbury and Akwesasne (Part 59) have the highest proportion of government transfer payments (26%), followed by the City of Cornwall (24%) (Table 5).
| Employment Income | Government Transfer | |
|---|---|---|
| Hawkesbury | 56% | 26% |
| Cornwall | 59% | 24% |
| South Dundas | 63% | 18% |
| North Glengarry | 65% | 18% |
| Alfred & Plantagenet | 70% | 15% |
| East Hawkesbury | 67% | 14% |
| Champlain | 65% | 14% |
| South Stormont | 70% | 13% |
| North Dundas | 72% | 13% |
| South Glengarry | 67% | 13% |
| North Stormont | 75% | 12% |
| Casselman | 73% | 12% |
| Clarence-Rockland | 74% | 11% |
| The Nation | 78% | 10% |
| Russell | 78% | 8% |
| Akwesasne (Part 59) | 62% | 26% |
| UC-SDG | 65% | 18% |
| UC-PR | 72% | 12% |
| Ontario | 73% | 11% |
| Canada | 72% | 12% |
Table 5: Composition of Total Income, EOHU, Ontario and Canada, 2015
Personal Income Distribution
The population living in the EOHU’s jurisdiction is not particularly well-off. Almost 60% of individuals aged 15 years and over and in private households, earn less than $40,000 a year and half of them (32%) earn less than $20,000 a year. This mirrors the Ontario rates. However, pockets of individuals earning a very low income (earning less than $20,000 a year) are found in Cornwall (39%) and Hawkesbury (41%). As for Akwesasne, 66% earn less than $20,000 a year and 82% earn less than $40,000 a year (Table 6).
| Population 15 years and over - 2015 | Ontario | EOHU | UC-SDG | UC-PR | Cornwall | Hawkesbury | Akwesasne (Part 59) |
|---|---|---|---|---|---|---|---|
| Without Income | 4.4% | 3.7% | 3.9% | 3.4% | 3.9% | 3.3% | 11.4% |
| With Income | 95.6% | 96.3% | 96.1% | 96.6% | 96.1% | 96.7% | 89.0% |
| Under $10,000 | 14.6% | 11.4% | 12.1% | 10.5% | 12.4% | 11.8% | 38.6% |
| $10,000-$19,999 | 16.6% | 17.6% | 19.1% | 15.6% | 22.6% | 25.6% | 16.2% |
| $20,000-$29,999 | 12.8% | 14.2% | 15.7% | 12.3% | 18.1% | 18.2% | 9.5% |
| $30,000-$39,999 | 10.4% | 12.0% | 12.7% | 11.1% | 13.6% | 13.6% | 6.7% |
| $40,000-$49,999 | 9.3% | 10.6% | 10.6% | 10.7% | 10.3% | 9.0% | 5.2% |
| $50,000-$59,999 | 7.3% | 8.4% | 7.8% | 9.3% | 6.5% | 6.3% | 3.3% |
| $60,000-$69,999 | 5.7% | 6.4% | 5.5% | 7.6% | 4.4% | 4.2% | 3.3% |
| $70,000-$79,999 | 4.3% | 4.5% | 3.7% | 5.5% | 2.5% | 2.5% | 1.9% |
| $80,000-$89,999 | 3.4% | 3.2% | 2.5% | 4.2% | 1.7% | 1.7% | 1.0% |
| $90,000-$99,999 | 2.9% | 2.7% | 2.2% | 3.4% | 1.5% | 1.3% | 1.9% |
| $100,000 and over | 8.2% | 5.2% | 4.3% | 6.5% | 2.5% | 2.5% | 1.9% |
| $100,000-$149,999 | 5.4% | 4.1% | 3.2% | 5.3% | 2.0% | 2.0% | 1.4% |
| $150,000 and over | 2.8% | 1.1% | 1.0% | 1.2% | 0.5% | 0.5% | 0.5% |
Table 6: Total Income Groups, EOHU Catchment Area and Ontario, 2015
Family Income
Similar to the picture revealed by the data on Personal Income Distribution (see table 6 above), close to 50% of families in private households in the EOHU’s jurisdiction are in the bottom half of Economic Family Income. This is similar to the Ontario rate. However, it’s worth noting that Cornwall and Hawkesbury have much higher rates of families living in the bottom half of Economic Family Income (Figure 10).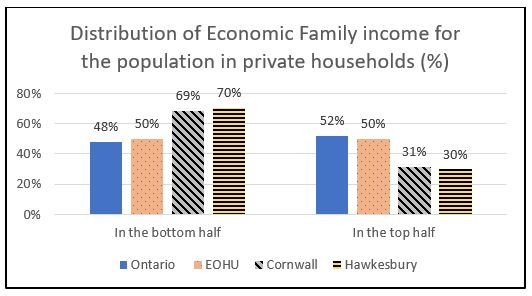
Figure 10: Economic Family Income Decile Group, EOHU and Ontario, 2015
Among the different municipalities in the region, the median family income varies from a high of $79,443 per year (Russell Township) to a low of $40,166 (Akwesasne). Table 7 shows that family income varies across types of families as well. Two-parent families with children have the highest annual family income, when compared to couples without children, lone-parent families and all economic families.
| All Economic Families | Couple without Children | Couple with Children | Lone Parent | |
|---|---|---|---|---|
| South Stormont | 87592 | 75706 | 112750 | 52800 |
| North Stormont | 90019 | 76178 | 109056 | 54592 |
| South Dundas | 76689 | 72192 | 97984 | 49696 |
| North Dundas | 92254 | 85577 | 110379 | 58752 |
| South Glengarry | 90822 | 79290 | 114483 | 56000 |
| North Glengarry | 74368 | 68124 | 98645 | 45568 |
| East Hawkesbury | 78208 | 69461 | 94208 | 52352 |
| Champlain | 86252 | 75699 | 114202 | 57472 |
| Alfred & Plantagenet | 82598 | 73472 | 107328 | 54272 |
| The Nation | 98389 | 86443 | 119392 | 58496 |
| Clarence-Rockland | 102388 | 88174 | 126615 | 63104 |
| Casselman | 98901 | 85888 | 133530 | 66816 |
| Russell | 117488 | 99808 | 141069 | 71680 |
| Akwesasne (Part 59) | 40166 | 39552 | 58624 | 18112 |
| Cornwall | 62249 | 62976 | 81137 | 38816 |
| Hawkesbury | 58007 | 56269 | 85589 | 39979 |
| UC-SDG | 75368 | 70814 | 98137 | 43959 |
| UC-PR | 94067 | 81242 | 121718 | 56602 |
| Ontario | 91089 | 81459 | 115381 | 54363 |
| Canada | 88306 | 78976 | 113465 | 53193 |
Table 7: Median Total Income ($) for Economic Families in Private Households, 2015
Low Income
Low-income measure, after tax (LIM-AT) in any jurisdiction is an important indicator of its economic viability. The Census explains the LIM-AT in the following manner:
The Low-income measure, after tax, refers to a fixed percentage (50%) of median adjusted after-tax income of private households. The household after-tax income is adjusted by an equivalence scale to take economies of scale into account. This adjustment for different household sizes reflects the fact that a household's needs increase, but at a decreasing rate, as the number of members increases.
When the unadjusted after-tax income of household pertaining to a person falls below the threshold applicable to the person based on household size, the person is considered to be in low income according to LIM-AT. Since the LIM-AT threshold and household income are unique within each household, low-income status based on LIM-AT can also be reported for households (Statistics Canada, 2016).
In the EOHU’s catchment area, 14.6% of the population falls at the LIM-AT level, which is very similar to the rates in Ontario and Canada. However, the incidence varies considerably across municipalities in the region. The highest incidence is reported in the Town of Hawkesbury, followed by the City of Cornwall, where just over a quarter of the population is living at LIM-AT. Russell Township and the City of Clarence-Rockland, on the other hand, have the lowest incidence.
| % of Persons Who Are Living at or Below the LIM-AT | Total | 0 to 17 years | 18 to 64 years | 65 years and over |
|---|---|---|---|---|
| Canada | 14.2% | 17.0% | 13.2% | 14.5% |
| Ontario | 14.4% | 18.4% | 13.7% | 12.0% |
| EOHU | 14.6% | 18.5% | 13.2% | 15.1% |
| UC-SDG | 17.9% | 24.4% | 16.6% | 15.5% |
| UC-PR | 10.5% | 11.7% | 9.0% | 14.5% |
| Cornwall | 26.3% | 37.7% | 25.5% | 18.2% |
| Hawkesbury | 27.5% | 36.6% | 26.7% | 23.4% |
| North Glengarry | 16.9% | 19.6% | 14.7% | 20.3% |
| South Dundas | 14.0% | 19.8% | 12.8% | 12.7% |
| Champlain | 10.7% | 10.1% | 9.7% | 13.9% |
| East Hawkesbury | 12.8% | 12.5% | 11.5% | 18.1% |
| Alfred & Plantagenet | 11.8% | 13.9% | 9.7% | 17.4% |
| North Stormont | 10.7% | 13.2% | 9.0% | 14.4% |
| North Dundas | 10.4% | 13.3% | 8.8% | 12.8% |
| South Glengarry | 10.7% | 13.4% | 9.7% | 11.5% |
| Nation | 9.1% | 10.9% | 7.3% | 16.3% |
| Casselman | 8.4% | 6.8% | 6.8% | 16.5% |
| Clarence-Rockland | 7.3% | 9.1% | 6.4% | 8.8% |
| Russell | 4.7% | 5.7% | 3.7% | 8.6% |
| Akwesasne (Part 59) | NA | NA | NA | NA |
| South Stormont | 10.0% | 12.4% | 9.2% | 10.5% |
Table 8: Total Low-Income Measure; After Tax (LIM-AT) Status, Per Age Group, 2015
Language
Language is important in the profile of a bilingual region such as the EOHU catchment area. In general, language is assessed by two measures: Home Language and Mother Tongue.
Home Language refers to the language that is spoken most frequently at home. About 96% of the EOHU target population reports having one home language (single response), either English (64.5%) or French (31.4%), as compared to 80% and 84% for Ontario and Canada respectively. The level of English or French as a single response varies considerably across the region, with most of the French concentrated in the northern counties. In Dundas County, more than 95.9% of the population reported English as their single response home language, whereas in Casselman and the Town of Hawkesbury, over 73% reported French as their home language. Most of the population with more than one (multiple response) home language within the EOHU region identifies the combination of English and French as home languages.
|
English Single Responses |
English Single and Multiple Responses |
French Single Responses |
French Single and Multiple Responses |
Non-Official Languages | |
|---|---|---|---|---|---|
| Canada | 63.8% | 68.1% | 20.0% | 21.1% | 11.5% |
| Ontario | 77.6% | 83.5% | 2.1% | 2.6% | 14.4% |
| EOHU | 64.5% | 67.0% | 31.4% | 33.4% | 1.5% |
| UC-SDG | 84.7% | 86.9% | 11.2% | 12.5% | 1.9% |
| UC-PR | 38.9% | 41.8% | 57.1% | 59.7% | 1.0% |
| South Glengarry | 79.1% | 81.4% | 17.0% | 18.8% | 1.7% |
| Akwesasne (Part 59) | 83.7% | 91.8% | 0% | 0% | 7.8% |
| South Stormont | 92.1% | 93.5% | 6.0% | 7.0% | 0.5% |
| Cornwall | 84.0% | 87.0% | 10.0% | 11.9% | 3.0% |
| South Dundas | 96.9% | 97.6% | 1.6% | 1.8% | 0.7% |
| North Dundas | 94.9% | 95.8% | 3.5% | 3.9% | 0.7% |
| North Stormont | 79.3% | 80.8% | 18.4% | 19.6% | 0.8% |
| North Glengarry | 64.7% | 67.2% | 31.7% | 33.6% | 1.2% |
| East Hawkesbury | 39.9% | 42.2% | 55.9% | 57.9% | 1.5% |
| Hawkesbury | 19.1% | 22.3% | 75.5% | 78.2% | 2.0% |
| Champlain | 40.1% | 42.2% | 56.7% | 58.7% | 0.8% |
| Alfred & Plantagenet | 25.1% | 27.8% | 71.3% | 73.8% | 0.8% |
| Nation | 36.0% | 38.8% | 60.1% | 62.8% | 1.0% |
| Clarence-Rockland | 40.7% | 44.1% | 54.9% | 58.1% | 0.9% |
| Casselman | 23.4% | 26.0% | 73.7% | 76.0% | 0.1% |
| Russell | 61.2% | 63.7% | 35.5% | 37.7% | 0.7% |
Table 9: The Distribution of Home Language, EOHU, Ontario and Canada, 2016
Mother Tongue, the first language that people learn to speak after they are born, is another important indicator, as it is closely related to the ethnic background of the individual. Over 97% reported a single response to mother tongue in the EOHU population, Ontario and Canada. There is a significant, but opposite difference, in the single responses of French and Non-Official Languages (NOL) populations in the EOHU region (39.2% and 4.2%), as compared to Ontario (3.7% and 26.7%). A similar contrast is observed by comparing English and French as a mother tongue for SDG (72.5% and 20.5%), as compared to PR (31.7% and 63%). On the other hand, Akwesasne mirrors Ontario’s rate of NOL. Please see Table 10 for more details.
|
Total Single Responses |
English Single Responses |
English Single and Multiple Responses |
French Single Responses |
French Single and Multiple Responses |
Non-Official Languages | |
|---|---|---|---|---|---|---|
| Canada | 97.6% | 56.0% | 58.1% | 20.6% | 21.4% | 21.1% |
| Ontario | 97.3% | 66.9% | 69.5% | 3.7% | 4.3% | 26.7% |
| EOHU | 97.9% | 54.5% | 56.5% | 39.2% | 41.0% | 4.2% |
| UC-SDG | 98.0% | 72.5% | 74.5% | 20.5% | 22.1% | 5.0% |
| UC-PR | 97.8% | 31.7% | 33.8% | 63.0% | 65.1% | 3.1% |
| South Glengarry | 98.1% | 64.8% | 66.6% | 28.0% | 29.6% | 5.3% |
| Akwesasne (Part 59) | 93.9% | 66.3% | 72.5% | 0.7% | 1.0% | 26.9% |
| South Stormont | 98.4% | 80.6% | 82.2% | 15.3% | 16.6% | 2.5% |
| Cornwall | 97.3% | 68.8% | 71.4% | 22.6% | 24.8% | 6.0% |
| South Dundas | 99.4% | 90.9% | 91.5% | 4.6% | 5.0% | 3.9% |
| North Dundas | 98.8% | 87.9% | 89.0% | 7.2% | 8.1% | 3.8% |
| North Stormont | 98.7% | 68.6% | 69.9% | 26.4% | 27.6% | 3.7% |
| North Glengarry | 97.9% | 55.1% | 57.1% | 38.9% | 40.8% | 4.0% |
| East Hawkesbury | 97.5% | 33.5% | 35.9% | 59.5% | 61.7% | 4.5% |
| Hawkesbury | 97.4% | 15.2% | 17.6% | 78.0% | 80.2% | 4.2% |
| Champlain | 98.1% | 33.5% | 35.2% | 61.3% | 63.0% | 3.3% |
| Alfred & Plantagenet | 98.0% | 19.9% | 21.9% | 75.6% | 77.6% | 2.4% |
| Nation | 97.9% | 28.8% | 30.7% | 66.6% | 68.5% | 2.6% |
| Clarence-Rockland | 97.3% | 32.1% | 34.6% | 62.4% | 64.8% | 2.9% |
| Casselman | 98.0% | 17.4% | 19.4% | 79.1% | 81.0% | 1.3% |
| Russell | 98.1% | 52.1% | 53.9% | 42.7% | 44.4% | 3.3% |
Table 10: The Distribution of Mother Tongue, EOHU, Ontario and Canada, 2016
Education
Compared to the rest of Ontario and Canada, the population in the EOHU’s jurisdiction is less educated. In the population aged 15 years and over in the EOHU region, the rates of either having no certificate, diploma or degree, or only a secondary (high) school diploma or equivalency certificate, are higher than in the rest of the province.
Conversely, the rates of the EOHU population who have completed post-secondary and higher levels of education are lower than the province. The level of educational attainments also varies considerably among the different municipalities; the Town of Hawkesbury has the highest percentage of the population that has less than a high school diploma, while Casselman and Russell Township, have the highest percentage of those with an university undergraduate degree or above (Table 11).
p
| No Certificate, Diploma or Degree | Secondary (High) School Diploma or Equivalency Certificate | Post-Secondary Certificate, Diploma or Degree | University Certificate, Diploma or Degree at Bachelor Level or Above | |
|---|---|---|---|---|
| South Stormont | 17.1% | 29.2% | 53.6% | 11.7% |
| North Stormont | 18.4% | 30.7% | 50.9% | 11.1% |
| South Dundas | 24.0% | 30.6% | 45.4% | 9.9% |
| North Dundas | 19.4% | 30.3% | 50.3% | 12.3% |
| South Glengarry | 18.6% | 27.9% | 53.6% | 15.9% |
| North Glengarry | 22.3% | 30.9% | 46.8% | 12.4% |
| East Hawkesbury | 17.9% | 33.2% | 49.0% | 15.8% |
| Champlain | 19.9% | 30.5% | 49.6% | 14.9% |
| Alfred & Plantagenet | 21.4% | 31.2% | 47.4% | 10.0% |
| Nation | 17.8% | 31.2% | 51.0% | 14.5% |
| Clarence-Rockland | 17.9% | 31.7% | 50.4% | 13.9% |
| Casselman | 21.3% | 26.2% | 52.5% | 17.6% |
| Russell | 14.9% | 29.4% | 55.7% | 20.2% |
| Akwesasne (Part 59) | 21.3% | 29.4% | 48.8% | 6.2% |
| Cornwall | 26.1% | 33.8% | 40.1% | 9.2% |
| Hawkesbury | 31.6% | 32.0% | 36.3% | 7.4% |
| UC-SDG | 22.4% | 31.4% | 46.2% | 11.0% |
| UC-PR | 19.7% | 30.9% | 49.4% | 14.2% |
| EOHU | 21.2% | 31.2% | 47.6% | 12.4% |
| Ontario | 17.5% | 27.4% | 55.1% | 26.0% |
Table 11: The Highest Level of Schooling for Population Aged 15 and Over, EOHU and Ontario, 2016
Change in Employment
| % of Population Aged 15 Years and Over | 2006 | 2016 | Change | 2019 |
|---|---|---|---|---|
| Cornwall | 7.6% | 9.9% | 2.3% | NA |
| Hawkesbury | 6.4% | 9.5% | 3.1% | NA |
| UC-SDG | 6.1% | 7.8% | 1.7% | NA |
| UC-PR | 4.2% | 5.3% | 1.1% | NA |
| EOHU | 5.3% | 6.6% | 1.3% | NA |
| Ontario | 6.4% | 7.4% | 1.0% | 5.4% |
| Canada | 6.6% | 7.7% | 1.1% | 5.5% |
Table 12: Change in Unemployment Rate
| National Occupational Classification | Canada | Ontario | EOHU | SDG | PR |
|---|---|---|---|---|---|
| Management Occupations | 11.0% | 11.3% | 10.8% | 10.7% | 11.0% |
| Business, Finance and Administration Occupations | 15.7% | 16.1% | 15.7% | 13.8% | 17.8% |
| Natural and Applied Sciences and Related Occupations | 7.0% | 7.4% | 4.9% | 4.0% | 5.9% |
| Health Occupations | 6.8% | 6.4% | 6.7% | 7.3% | 5.9% |
| Education, Law and Social, Community and Government Services Occupations | 11.7% | 11.9% | 12.0% | 10.6% | 13.5% |
| Arts, Culture, Recreation and Sports Occupations | 3.1% | 3.2% | 1.8% | 1.8% | 1.9% |
| Sales and Service Occupations | 23.4% | 23.4% | 21.8% | 23.1% | 20.5% |
| Trades, Transport and Equipment Operators and Related Occupations | 14.6% | 13.3% | 19.2% | 20.1% | 18.1% |
| Natural Resources, Agriculture and Related Production Occupations | 2.3% | 1.6% | 2.7% | 2.8% | 2.6% |
| Manufacturing and Utilities Occupations | 4.5% | 5.2% | 4.5% | 5.8% | 2.9% |
Table 13: National Occupational Classification, 2016
Conclusion
The Social Determinants of Health are all interrelated, and therefore affect one another. As identified within the various tables in this report, the EOHU population as a whole or in part, is negatively influenced by the Social Determinants of Health to a greater degree than the rest of the province.
Income determines the quality of other social determinants of health such as food security, housing, education, and other basic prerequisites of health. Populations with less education and low literacy skills are more likely to be unemployed or work at lower paying jobs with poor working conditions and little or no benefits. Education is therefore regarded as a very important route out of poverty.
According to the literature:
The relationship between education and income is strong. Education is often referred to as an investment in human capital. In general, the more skills people have, the more employable they are. It is important to realize, however, that the relationship among education, income, and wealth is more complicated than simply more education yielding a higher income and more wealth. Factors such as natural ability and family background also impact both income and wealth and are not caused by having more education. (Scott A. Wolla and Jessica Sullivan, 2017)
Here is a comparison table that links income, education and family status for the EOHU’s jurisdiction and Ontario.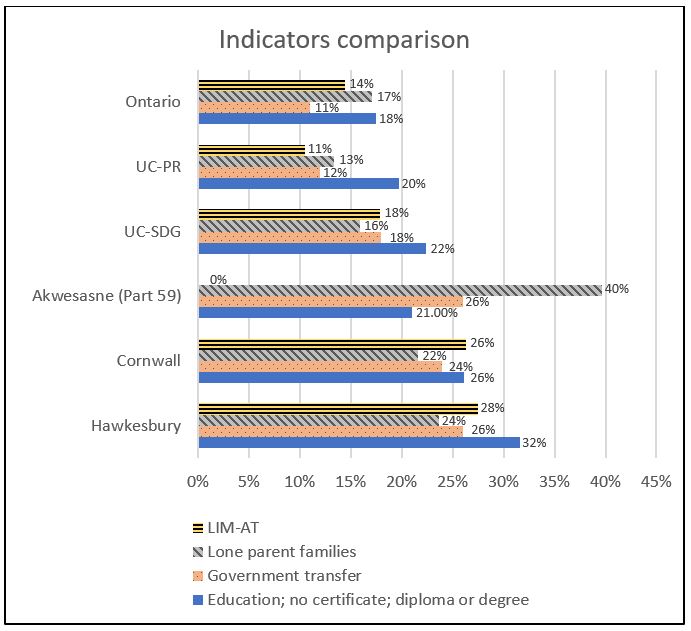
Figure 11: Comparison Between Low Education, Lone Parent Families, LIM-AT and Government Transfer
References
Scott A. Wolla and Jessica Sullivan (2017). Education, Income, and Wealth. Retrieved from: https://research.stlouisfed.org/publications/page1-econ/2017/01/03/education-income-and-wealth/
Statistics Canada, Census Data (2016). Income Highlight Tables, Low-income measure, after-tax (LIM-AT). Retrieved from: https://www12.statcan.gc.ca/census-recensement/2016/dp-pd/hlt-fst/inc-rev/Table.cfm?Lang=Eng&T=306&SR=1&S=86&O=A&RPP=25&PR=0&CMA=0
Statistics Canada (2019). Labour Force Survey. Retrieved from: https://www150.statcan.gc.ca/n1/daily-quotidien/190705/dq190705a-eng.htm

